“Looking for grid! 💕” – A step-by-step guide to analyzing grid connection capacity
Who wants to wait months for a network operator to respond regarding grid connection capacity? With the right data, you can gain a good understanding of the local grid situation yourself and prioritize projects for new power generators or consumers accordingly. Here's how to do this with the data and functions in dvlp.energy web GIS.
Who wants to wait months for a network operator to respond on a grid connection request? With the right data, you can gain a good understanding of the local grid situation yourself and prioritize projects for new power generators or consumers accordingly. Here's how to do this with the data and functions in dvlp.energy web GIS:
⚡️ Step 1 - Analyse substation utilization
What: Comparison of connected generation vs. consumption capacity to determine whether the substation is generation- or load-dominated
How:
- Generation: The connected or supplied generation capacity shows the generators directly connected to a substation and their capacity (assigned via the technical grid location) or the capacity indirectly supplied by generators via power lines (locations in the vicinity of the substations).
- Consumption: The average and maximum load shows the average and peak load from private consumers (determined based on the number of residents in the vicinity of the substations) and industry (determined based on the number of industrial sites in the vicinity of the substations).
Why: For generation-dominated substations, it makes sense to connect a data center, for example, while for load-dominated substations, it makes sense to connect new solar or wind farms. For balanced UWs, the connection of a battery storage system is likely.
🗺️ Step 2 – Assess power network class
What: The same comparison can also be made at the municipal level to find out whether the municipality is generation- or load-dominated.
How:
- Generation: Determined based on all generation capacities located in an administrative municipality according to the market master data register.
- Consumption: Determined based on the population and industrial areas in an administrative municipality.
If the generation capacity of wind and solar is greater than the average load, then the area is classified as “RE-dominated” otherwise “Load-dominated”.
Why: Same logic as for “substation utilization,” but at the regional level.
🥤Step 3 – Identify grid bottlenecks
What: Identification of lines/areas that, according to network operators, are already affected by network congestion or will be in the foreseeable future.
How: All major grid operators regularly publish maps showing grid congestion lines/areas for various scenarios (e.g., feed-in/load case, 2028/2033/2045)—we digitize these maps.
Why: These should be avoided unless the bottlenecks are resolved in a timely manner or are clearly due to generation or load.
🚧 Step 4 – Analyse network expansion measures
What: Analysis of planned measures with regard to added capacity and schedule – the justification for the measures often also contains information on the current grid situation.
How: All major grid operators regularly publish lists of all planned grid expansion measures with information on the measure, justification, schedule, costs, and added capacity – we digitize and georeference these lists.
Why: Grid areas with high expansion indicate current high utilization, but may be suitable for new generators/consumers with a similar schedule.
🤹 Step 5 – Check redispatch
What: Review of these interventions, which grid operators use to respond to acute generation-related grid congestion (i.e., shutdown of wind and solar power) – they often provide deeper insight into whether congestion is caused by too much solar or wind power.
How: Some grid operators publish the redispatch measures implemented in their grid area. We assign these measures to the generation plants from the market master data register and then aggregate them at the substation level and at the administrative municipality level.
Why: Similar to congested lines, these areas should be avoided by new generators using the same technology; depending on where exactly the bottlenecks are located, these regions may be well suited for new consumption capacity.
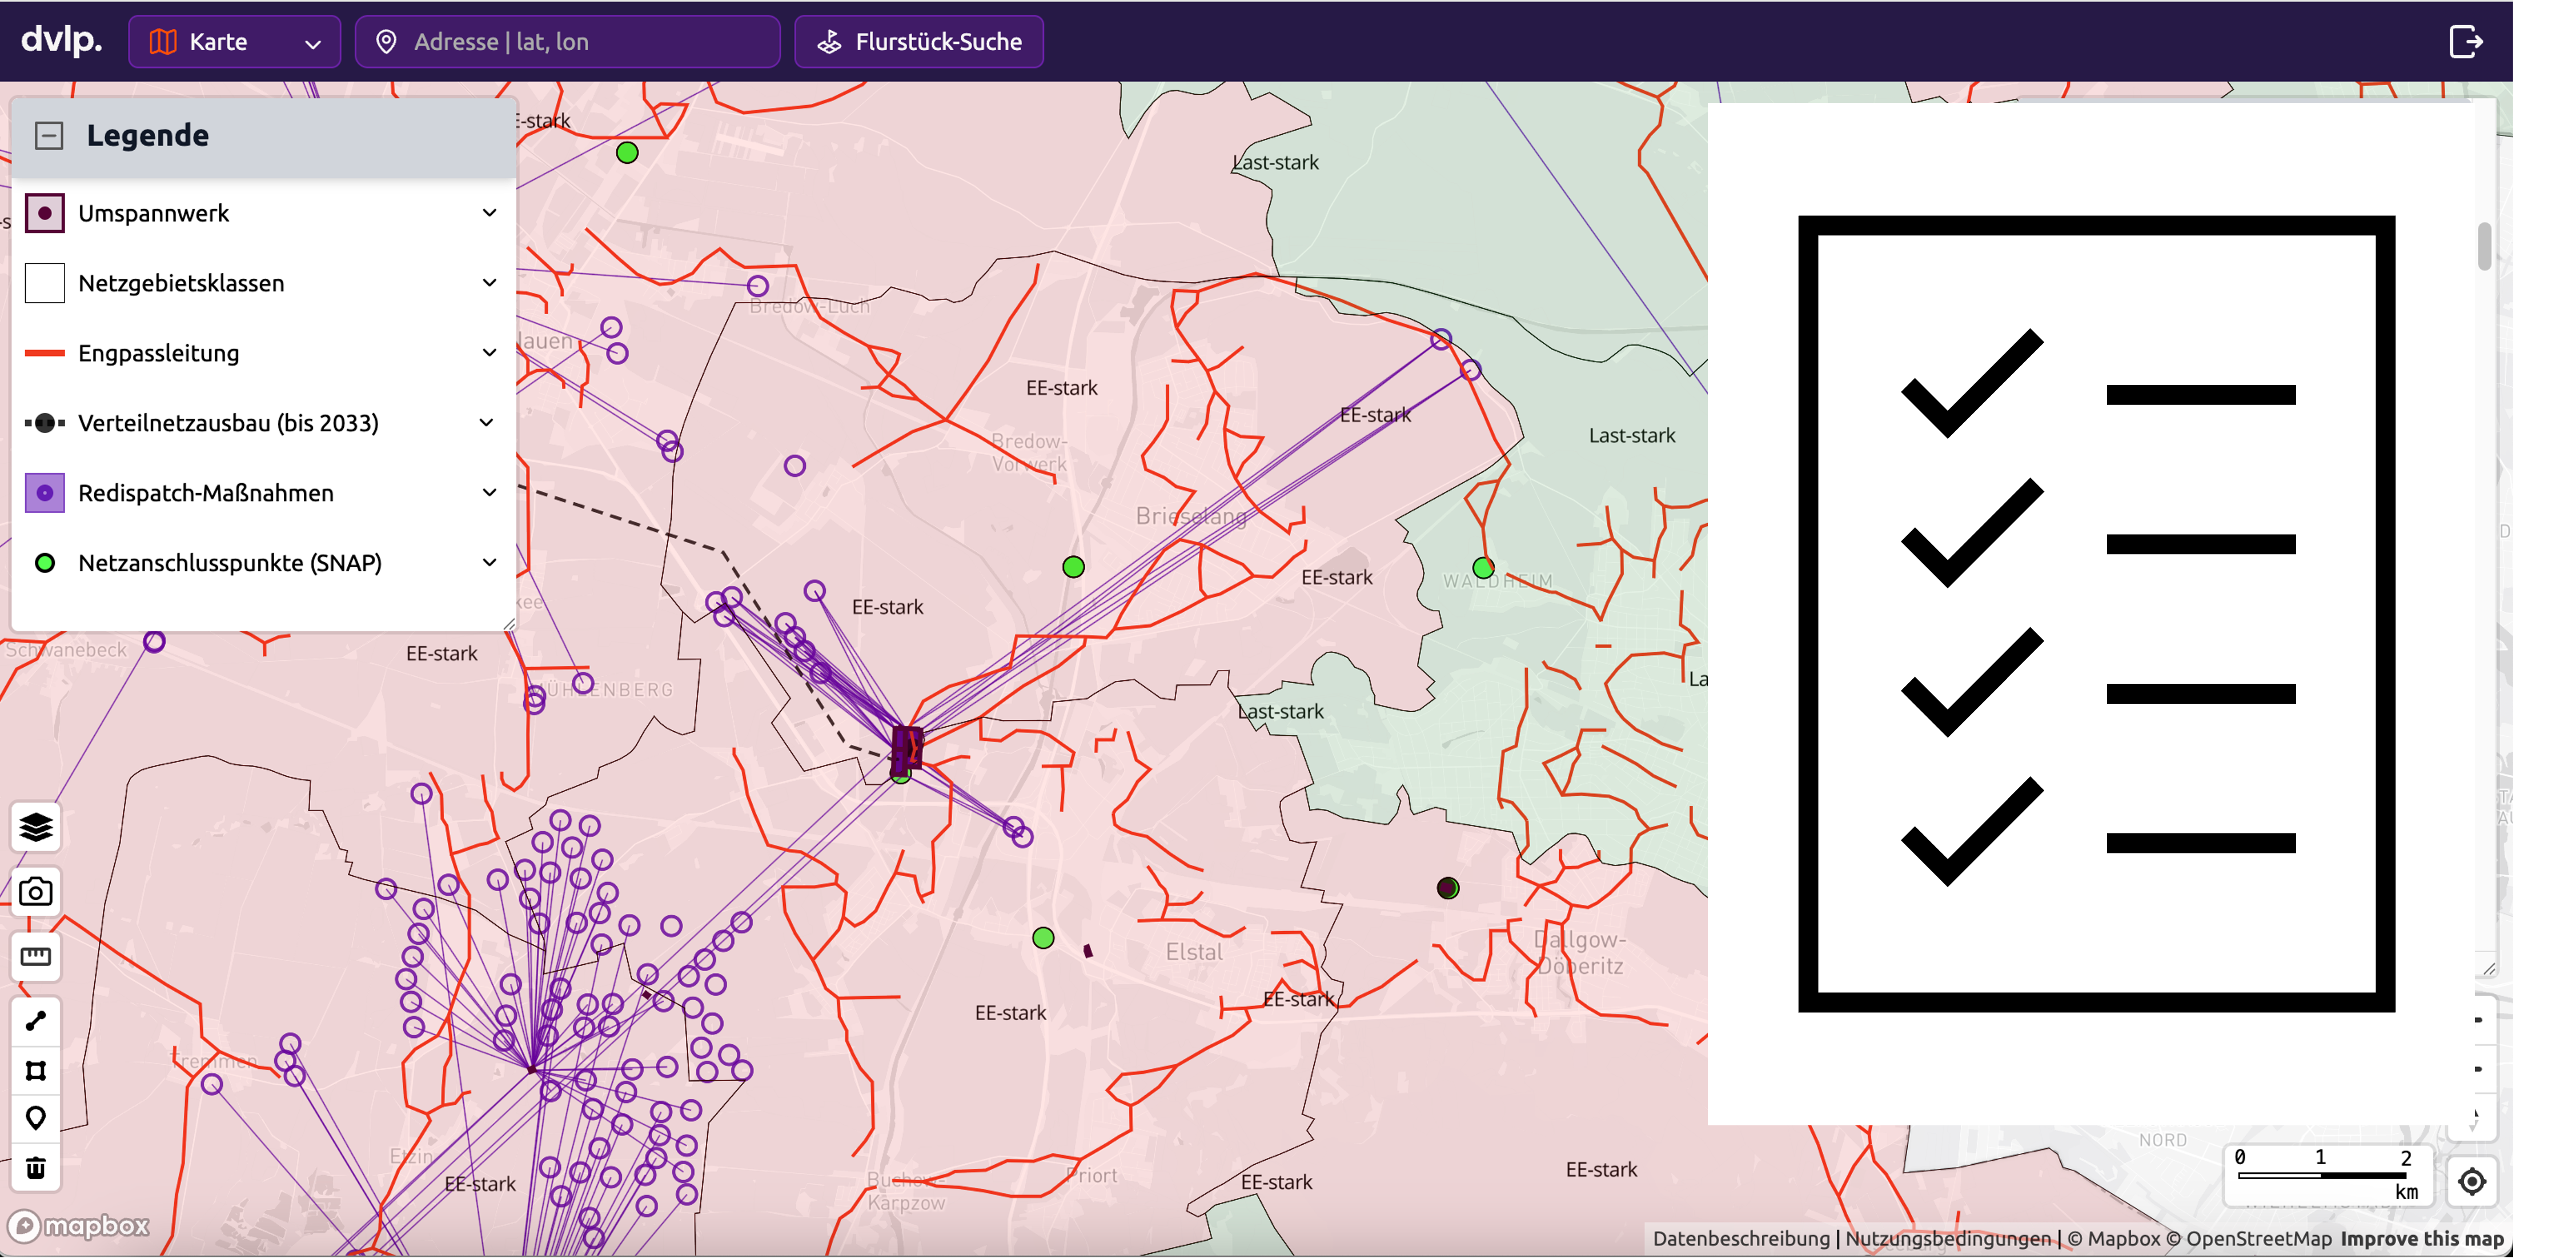
✅ Step 6 – Check "Schnelle Netzanschlussprüfung" (SNAP)
What: Review of grid connection points identified by the grid operators' "SNAP" tools – ideally, the entire grid area with different connection capacities is checked here in order to gain a comprehensive understanding of the grid situation.
How: By collecting and displaying all reported grid connection points for inquiries made for different connection capacities and for the entire grid area, we create an overall picture of the grid situation.
Why: In regions where many grid connection points for large capacities (e.g., >5MW) are reported, a cost-efficient grid connection is likely.
💕 Step 7 – Activate GridConnect
What: Search for potential partners for a grid connection in the region
How: By activating the GridConnect function in dvlp web-GIS, we search within a 20 km radius of the project for projects by other developers who have also activated the GridConnect function. If there is a match, we inform both parties without revealing any specific details about the projects. If both parties are interested, we establish contact (more information: https://www.dvlp.energy/en/blog/gridconnect-ist-live)
Why: It may be that developers/operators in the region have been allocated or promised grid capacity and can realize this with your help – if other developers in the region are also just searching, this confirms the hypothesis of a low probability of grid connection.

%20(1).png)
